Please note, this is a screening valuation only. This is not a full fledged valuation of the subject shares and therefore should not be used as the final basis for any investment decision.
Prior to performing a detailed valuation on a business, as illustrated in the many examples below, I perform a ‘screening valuation’ of various businesses in order to determine where I should direct my detailed analysis effort. In order to screen businesses I focus on the following elements or numbers of the considered businesses:
• 10 years of Earnings per Share (EPS) data
• 10 years of deflated EPS data
• 10 years of ROE data
• analyst or consensus forecasted EPS growth rate, if available
• lowest P/E ratio over the last 5 to 10 years
• the average Retention Rate (RR) of the business
• the latest available Book Value per Share (BPS)
Using this set of data for each business considered I calculate a number of ratios and returns for each to help me identify potential value investment candidate businesses. Businesses that pass this initial screen will further be analyzed in detail. From the detailed (individual) analyses investment decisions will be made, i.e. the decision as to where investment capital will be allocated.
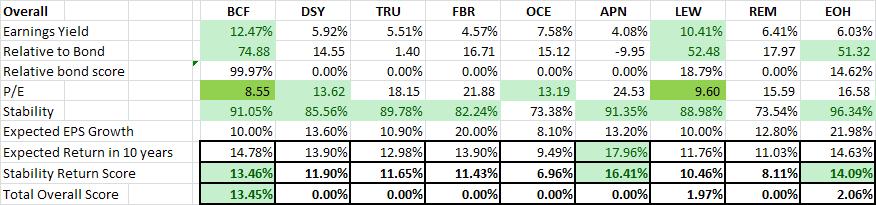
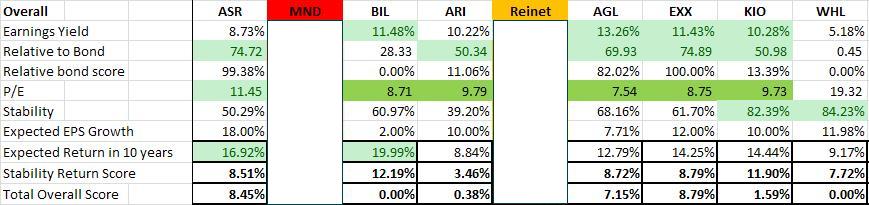
In this post I will be comparing 18 different value stocks as of 28 May 2012. The table below shows the final result of the analysis (I have excluded Mondi and Reinet's screens due to incompleteness of my analysis or incompleteness in the data available). This table shows the result of my screening calculations (not shown in this post) and include 8 overall calculations. Below I have described some of them. They are: - Relative to Bond Yield - I calculate the earnings for a share based on the latest earnings per share (EPS) and current share price (i.e. E/P). I then calculate the historical EPS growth rate and, combined with the analyst expected forecasted EPS, estimate the relative EPS for the next 10 years and possible relative share price in 10 years, if I invested R100 in this business today. I then compare this to the return of R100 invested in a 10 year South African government bond
- Stability Score - I calculate the stability in growth of both the historical EPS and historical Deflated EPS. The stability of growth of Earnings-, Sales- and Book Value per Share are vitally important for any value investor.
- Expected EPS Growth - the expected EPS growth is based on the historical growth rate and the analyst estimate. The expected EPS growth is very conservative to ensure that we rather under-promise and over-deliver than the alternative.
- Expected Return - the compounded annual rate of return is estimated using two different techniques. The first considers the EPS growth over the next 10 years and the second considers the growth in book value over the next 10 years. Both estimate the future share price from these numbers, includes the possible dividends over the next 10 years, and then calculates the expected compound annual return. As can be expected these approaches produce different results, and the final expected return is the average of the two results.
- Stability Return Score - we now come to the crux of the matter. I take the stability score and multiply it with the expected return. This gives me a stability return score, i.e. the expected return impaired for the stability (or instability) of the earnings history. The stability return score forms the basis of the decision whether to further investigate, i.e. perform a detailed analysis of, the business.
- Total Overall Score - I use the stability return score, multiplied by the relative bond score, to calculate the combined effect of the expected return and relative performance to a R100 10 year South African government bond.
The relative ratios and numbers calculated above allow me to screen various possible investments in order to identify the best possible investment candidates. There are a number of other screens not shown here, e.g. price-to-earnings ratio's, price-to-book ratio's, Return on Invested Capital, management screens, competitive advantage screens, etc. My recommendationsI hope you have enjoyed this short valuation example. Based on the above I further analysed (in detail) BHP Billiton. Finally, after the detailed analysis of BHP and other current investment shares, I made my investment recommendations for Richland IH and we will allocate investment capital based on these decisions. A word of warning to anyone contemplating investing in mining shares/commodities: this is a very specialized field and a tenet of any value investor is to remain within his or her circle of competence. Resources are very attractive to value (i.e. long-term) investors, i.e. the world population is growing and although growth in economies speed up and slow down the demand for commodities will just increase in years to come, who are willing to invest in companies with diversified and extensive resource basis (i.e. ore bodies in the ground), that have good management in place, have good distribution networks in place (especially in emerging and high growth markets), are willing to remain invested for the long-term, and fully understand the risks of holding commodity shares (i.e. if they have to sell during a commodity down cycle they will be punished for the decision - commodity companies are price takers not price makers). Please feel free to contact me in case you have any additional questions or suggestions regarding this, or any other, valuation. Always remember to live every day to be a 105%'er ;) Be Extraordinary!
Myles Rennie
P.S. The above analysis should not be considered investment advice. I will not be held liable for any investment decisions, or investments, made based on my analysis.
 This is another valuation done for Richland IH. We have been considering Truworths as an investment opportunity with some other great South African companies. Truworths is, as this post will show, a great company with some pretty amazing business economics, but it is expensive. Read the post to see what I would recommend for all long-term/patient value investors regarding Truworths. Our goal at Richland IH is to create sustainable wealth, over the long-term, by following the principles laid down by some of (what I classify to be) the most successful investors of all time. Our investment analysis approach always rests on thorough analysis of the underlying security in order to ensure safety of principal and an adequate return. There are always four major criteria that any investment has to comply with: - It should be a simple business to understand within my circle of competence
- It should have good management in place
- It should have a sustainable or durable competitive advantage
- It should have favourable economics
In the valuations I post here I focus on the last two criteria and demonstrate below how I consider these. Without further delay, let's delve into Truworths (ticker symbol: TRU).
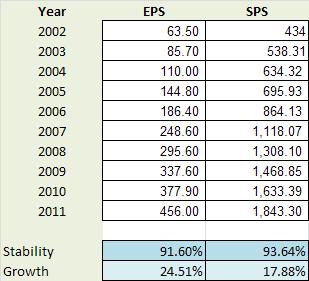
Phase I: is this a company I want to invest in? In order to determine whether I will invest in this business (please note that I do not refer to a stock as a stock but rather as a business and therefore all valuations are based on logic and sound business principles more than anything else) I would first like to focus on what I call my SGS criteria, i.e. Stability, Growth, and Sustainability of the business. Stability and Growth of Earnings per Share (EPS) and Sales per Share (SPS) of Truworths
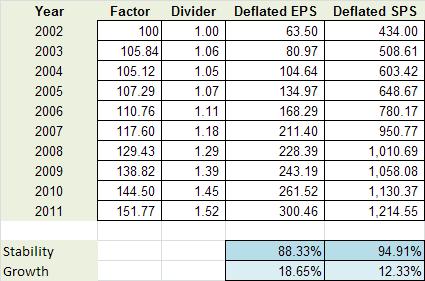
My first criteria in valuing a business is always stability and growth. I am looking for stable businesses growing at an acceptable rate. Stability through a cycle (i.e. through market cycles) demonstrates that the firm can weather storms, pass on price increases to customers, and have management in place that can steer the firm clear of serious fluctuations and danger. | | I measure stability and growth of both EPS and SPS over the past 10 years. 10 years represents one or more market peaks and troughs which allows me to track through-the-cycle stability and growth. I measure these numbers based on year to year EPS and SPS. Stability is expressed as a percentage in the range 0 to 100 percent. A high stability percentage corresponds to high stability and a low stability percentage corresponds to low stability. Stability of 100 percent signifies complete stability, meaning that the data is changing by exactly the same percentage year-on-year. I have developed a number of Microsoft Excel functions to perform these calculations for me. These functions are intelligent enough to remove outliers, weigh more recent data as more important, etc. | TRU's Earnings per Share stability is 91.6% which is a very high level of stability. Consider the fact that we just survived the second biggest world-wide recession of recorded times and that TRUs EPS does not even show it, and you can't help but be amazed. What is even more amazing is that TRUs Sales per Share (SPS) is stable at 93.6%. This is almost perfectly stable. | | Next we consider what effect inflation had on TRUs EPS and SPS. From the table it is clear that inflation over the last 10 years impacted TRUs EPS stability slightly negatively whereas it shows that TRUs SPS displays even more stable. The reason I look at deflated (or real) EPS and SPS is to see how sensitive the stability score is to inflationary pressure. The astute investor needs to understand and be satisfied with the firms stability in real and nominal terms. | From these tables I conclude that I am satisfied with both the nominal and real stability scores of TRU and therefore it is a pass for this criteria. This is the first indicator of a business with a durable competitive advantage.
Next I start considering the compound annual growth rate of EPS and SPS over the past 10 years. As per the stability criteria above, I will consider firm EPS and SPS growth on a real and nominal basis. Inflation, especially in South Africa with relatively high inflation, can lead to 'high' or 'attractive' nominal growth numbers and it is good practice to understand the real growth (note that the Earnings growth rate used when performing a Equity Valuation Discounted Cash Flow (DCF), calculated as the product of the Retention Rate and Return on Equity, is very close to the real EPS growth rate calculated in the table above - thus, the real EPS growth rate is an important number in valuations).
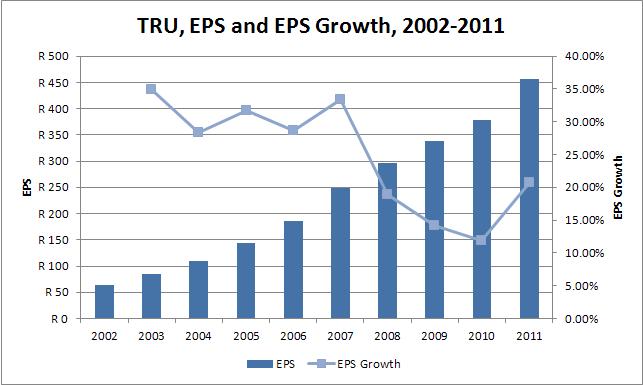
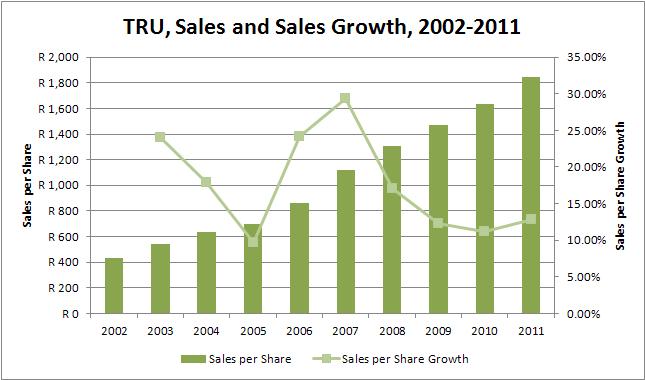
I developed Microsoft Excel functions to calculate the historical growth rate. These functions do not simply calculate the average or compound growth rate of the 8 years, they consider the annual growth rate year on year. TRUs deflated EPS grew by 18.65% year on year wheres its SPS grew lower at 12.33% per year. These are fantastic growth rates considering that the effect of inflation has already been removed. EPS growing at 18.65% compounded annually should take between 4 and 5 years to double, and that sound very attractive indeed. These amazing growth rates (both EPS and SPS) is the second indicator that TRU has a durable competitive advantage. The figures below show respectively EPS vs. EPS Growth, and SPS vs. SPS Growth for TRU.
I love these two graphs above. Notice that both EPS and SPS growth never slumps below (plus/minus) 10% year-on-year. These graphs point to a business with great economics. I also like the way that both the EPS and SPS growth curves are starting to 'pull-up' and to the right as TRU recovers from the recession. TRU also pass the growth criteria.
I am looking for businesses that have stability percentages of 80 percent or more for both their earnings and their sales. If a company does not satisfy this criterion, I usually just pass it by. After all, if there was little stability in sales and earnings in the past, then it becomes virtually impossible to make confident forecasts for the future.
Return on Equity (ROE) and Return on Invested Capital (ROIC) of Truworths
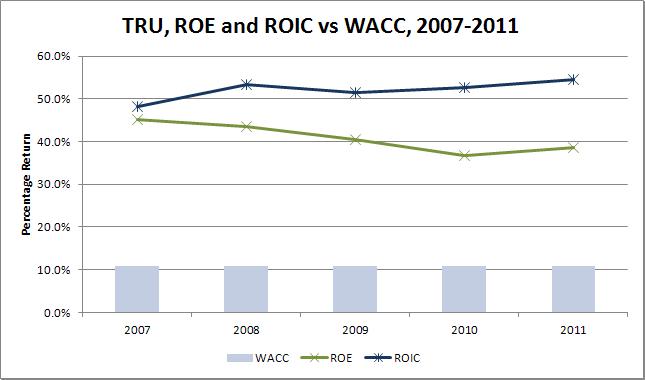
I like companies with an above average Return on Equity (ROE) of at least 18% or better, as this is another indicator that the company has a durable competitive advantage. Because some companies can be financed with debt that is many times their equity, they can show a consistently high ROE, yet still be in unattractive price competitive businesses. To screen out these companies I consider a firms Return on Invested Capital (ROIC) in conjunction with its ROE. A firms ROIC must be higher than 15% and its ROIC must be higher than its Weighted Average Cost of Capital (WACC), else it will fail my screening.
| | Keep in mind that if a company can maintain its ROIC consistently above its WACC it is creating value for its shareholders. A company that has a ROIC lower than its WACC, irrespective of the rate of growth of the company, is destroying value. In fact, when ROIC is smaller than WACC, then the faster the company grows the faster it is destroying value!
| Calculating the WACC of a business can be a complex task. There are many different ways of calculating the Cost of Equity and the Cost of Debt of a business. The calculations for TRUs Cost of Equity, Cost of Debt, and WACC is not displayed here, but if required please email me (see my contact form) and I will gladly supply the calculations (and the thinking). In short, I calculated TRUs WACC as follows: - I took an extremely conservative approach to TRUs year-on-year Cost of Equity. I estimated a BETA of 0.35, a risk free rate of 8.5% and a Equity Premium of 7%. This yielded a Cost of Equity (using CAPM) of 11%
- I used a synthetic bond rating approach to calculate TRU's year-on-year Cost of Debt
From the graph above it is clear the TRU has a fantastic ROE at an average 40%. Its ROIC is even better at an average of more than 50%. This implies that for every RAND of debt or equity provided to Truworths it generates about R 0.50 (or 50 cents) return per annum. This is truly amazing! TRUs average ROE is much higher than the required 18% and the average ROIC is also much higher than the required 15%. Furthermore, the ROIC is much higher than the average WACC of 10.9%. Therefore, management is creating value for shareholders at a fantastic pace. The consistently high ROE and ROIC rates is the third indicator that TRU has a durable competitive advantage. TRU pass this criteria. Corporate Stability of Truworths
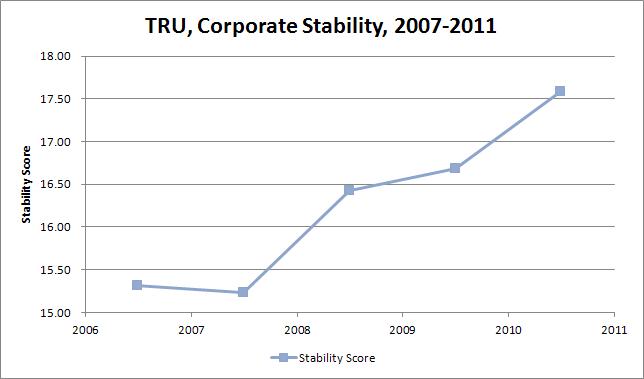
I like companies that demonstrate a high level of corporate stability over the long term. The functions I have developed in Microsoft Excel to measure corporate stability consider a number of different financial ratio's of a firm to determine a stability score. A high corporate stability score is required before considering any investment in the company. | | A score above 8.15 indicates little chance of the business failing based on current management principles. The average stability score for TRU over the last five years has been 16.25 which is much higher than the required 8.15 for a very stable company.
| This is the kind of company I like to invest in, because it has a good chance of still doing what it is doing, and being in business, 10 years from now. TRU is the kind of business I can invest in and forget about, come back in ten years, and it is very likely to still be going strong.
The consistently stability score is the third indicator that TRU has a durable competitive advantage.
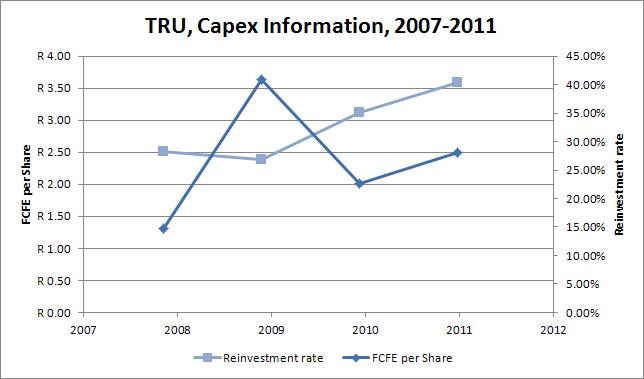
TRU pass this criteria. Capital expenditure of Truworths
I like companies that do not have major capital expenditures, i.e. I look for companies that do not need to spend a lot of money on major upgrades of plant and equipment or on research and development to stay competitive. | | TRUs free cash flow per share over the past four years are all positive, indicating that the company is generating more cash that it is consuming. Its average FCFE per Share for the last four years was R 2.90. It showed positive Reinvestment Rates over the last four years with an average of 26.6%. This shows that TRU is investing in the future (i.e. investing in its growth assets).
| These are both favorable signs, and so the company passes this criteria.
TRU pass this criteria. Debt position of Truworths
I like businesses that are conservatively financed. Nonetheless, I am willing to invest in firm with solid bond ratings. In South Africa it is not always easy to obtain a bond rating for a firm, and therefore I have developed functions that calculate a synthetic bond rating based on the fundamentals of the business. TRUs synthetic bond rating is calculated as "AAA" based on both its corporate stability rating and the fact that its interest cover ratio is very, very high. In fact, TRU shows no of debt currently on its balance sheet (2011) which is considered exceptional. TRU has very strong earnings and will be able to repay a substantial amount of debt based on it.
TRU pass this criteria. Use of Retained Earnings by Truworths
This is one of Buffett's main screening criteria, and I love it was well. Buffett likes to see if management has spent retained earnings in a way that benefits shareholders. To determine this, Buffett takes the total amount of retained earnings over the previous 10 years of 1147.11 cents per share and compares it to the gain in EPS over the same period of 390.50 cents. TRUs management has proven it can earn shareholders a 34.2% return on the earnings they kept. This is a fantastic number and one can say that management is doing a great job of putting the retained earnings to work.
TRU pass this criteria.
This concludes the quantitative elements of the Phase I valuation. Next the valuation moves to Phase II. Phase II: should I buy based on the economics? If and when I get positive responses to all the above criteria, I then proceed with a value vs. price analysis. The value analysis will determine whether or not the stock of the business should be bought. The following is how I evaluate TRU quantitatively.
I start by understanding the intrinsic value of the business from the perspective of the Balance Sheet, then the Income Statement, and finally I look at the growth value of the business, i.e. Discounted Cash Flow based on Free Cash Flows. Intrinsic Valuations
I have decided not to show the BS and IS valuations in this post. Instead I will show the two DCF valuations, i.e. Free Cash Flow to Equity holders (FCFE) and Free Cash flow to the Firm (FCFF) respectively. The FCF valuations value the operating assets in the business, both existing and growth assets. I use the FCF valuations to determine the upper end of intrinsic value (i.e. the more optimistic possible intrinsic values).
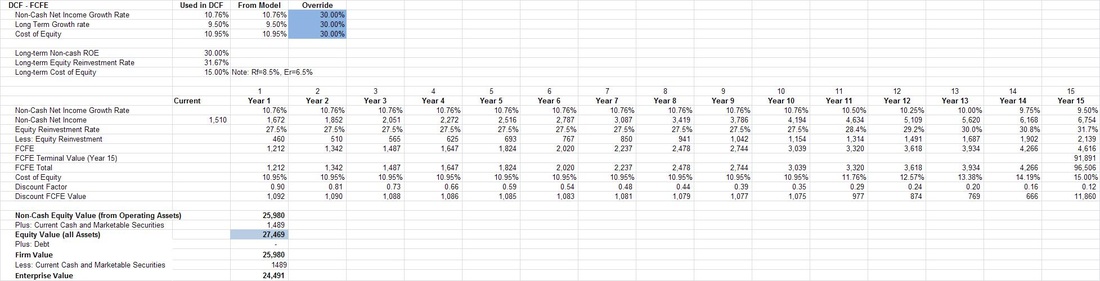
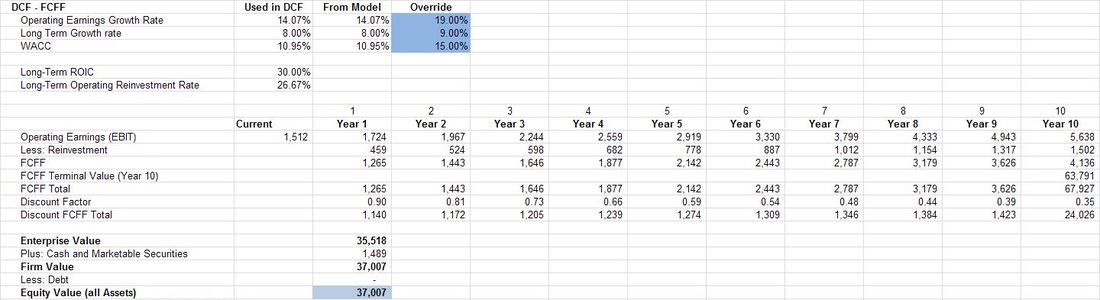
Here I performed both FCFE and FCFF valuations, but in both cases calculate the intrinsic equity value of the business, that which a shareholder would be interested in. Enterprise value, as a matter of interest, would be the value that someone buying the entire business would be interested in. Below is the three-stage FCFE calculation. You are more than welcome to contact me if you would like information as to any of these calculations. Below is a two-stage FCFF calculation. I calculated the FCFE and FCFF using different stage models just to see the difference in valuation. You will notice there is a difference between the two valuations. They should be close together, but there are good fundamental reasons why they could differ. The most relevant is that I don't calculate the FCFF and FCFE from a forecasted Income Statement or Balance Sheet. Rather, I calculate fundamental growth rates for Net Income and Operating Earnings respectively and these rates are based on the average Equity Reinvestment Rate, ROE, Operating Reinvestment Rate, and ROIC of the last five years. Therefore, they will result in differences. Note also that this is a risk for valuation, these slight input variable differences cause large valuation differences.
In the rest of the valuation I use the average of the two values to estimate a more realistic intrinsic DCF value. Intrinsic Value - putting it all together
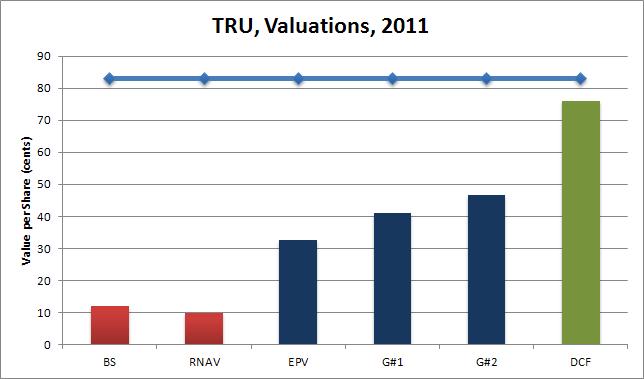
From the exercise above I obtained a number of different intrinsic values for BCF. I usually also do two Graham Valuations as described in Chapter 39 of his 1962 Security Analysis. The value (which is based on earnings) is calculated for TRU using Graham's approach and is shown as G#1 and G#2 in the graph below. Note that BS shows the Replacement Asset intrinsic value. IS shows the Earnings Power Value. DCF show the average DCF values form the perspective of both FCFE and FCFF analysis. The graph shows the current share price (roughly R 83.00 per share at the time of writing) as the dark blue line at the top of the graph. First you will notice that all intrinsic valuations are less that the current share price - therefore the share can be considered expensive and as having no margin of safety.
You will furthermore note in this graph that both the BS (Balance Sheet Book Value) and RNAV (Replacement Net Asset Value) values are less than the EPV (Earnings Power Value from the Income Statement) value. Also, both the BS and RNAV values are less than the two Graham values (i.e. G#1 and G#2). This is the final indicator that TRU enjoys a durable competitive advantage.
Now notice that EPV , G#1 and G#2 are all less that the valuation considering growth, i.e. DCF (which in this case is the average FCFE and FCFF valuations). The bars in this chart show a classic example of a company with a durable competitive advantage and with considerable growth assets to consider in the valuation. This graph only shows the valuations for 2011, but in my analysis the gaps are consistently positive positive for the last five years.
Based on the analysis above a fair price to pay for TRU (at the end of June 2011) would be somewhere near R 45.00 per share. Paying more than that would imply paying for potential growth, not something a value investor likes to do. Most value investors, like myself, like to buy assets at a discount (which gives a margin of safety). Therefore, a value investors buy price would be 75% of the fair value: R 33.75 = R 45.00 x 75%.
In order to make the final investment decision I have to consider what my potential return on investment (ROI) could be if I bought at the various values presented in the graph above. Based on the valuations above what is the expected return in 10 years?
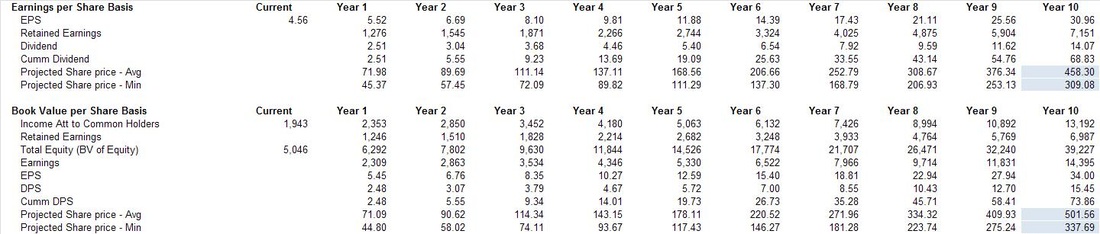
The final step in the valuation is to determine what the expected total return (i.e. share price and cumulative dividend's over the next 10 years) value could be in 10 years time given the current book value, earnings per share (EPS), payout ratio, P/E ratio, EPS growth rate, Equity Reinvestment Rate, ROE, Net Income Growth rate. I perform two calculations to determine the possible future share price.
The first method starts from the perspective of the latest EPS and the second method starts from the current book value. Both values work on a similar basis, i.e. project possible EPS in 10 years time, multiply this number by a VERY conservative P/E ratio (based on the minimum P/E over the last 10 years) to get the possible share price in 10 years, and add the expected dividend to be received over the next 10 years to get to total returns expected (IF you leave your dividend in the return - something all value investors ascribe to). The result is the table below showing the two methods. All the details of the EPS growth rates, Net Income growth rates, etc. (all determined from fundamental growth formulas) are not shown. Please contact me if you would like to see this information and I would happily provide it. These methods project a future return of between R309 and R337 on the low end to R458 and R501 on the high end. The spread is due to different P/Es used to project the future price and some of the other intrinsic factors, i.e. slight differences in the fundamental growth rates of, for instance, EPS vs. Net Income. Faced with this type of spread I choose to be conservative and peg a possible future return at the lower end of the scale or averaging the possible returns (I guess most analysts would choose the top end of the scale to justify purchases). Once I have a relative range of future return I can calculate the expected compound annual return from the various valuations to this range. Interpreting the results
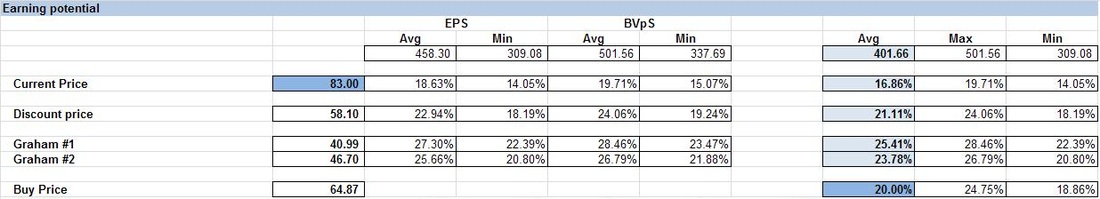
This table of expected compound annual returns is shown below and requires a little explanation next. Let's start with the top row showing the spread of various possible future returns (the same as in the table before it). From this I calculate the overall average expected future share price to be R 401.66 in 10 years time. This is our starting point because this is the number I peg as the possible future return expected. In the left most column, I show the current price (i.e. R 83.00), the discount price from here (i.e. R 58.10), the two Graham intrinsic values (i.e. R 40.99 and R 46.70 respectively), and I calculate at which price you should buy if you would like to earn a compound annual return of 20% given the possible future expected return of R 401.66. This latter number, which is a VERY important number, is calculated to be R 64.87 and is, as a matter of interest, close to half-way between the two Graham valuations and the DCF valuations shown above. In summary then from the table above if you: - purchase at R83.00 you can expect an possible compound annual return of 16.86%
- purchase at R58.10 you can expect an possible compound annual return of 21.11%
- purchase at R40.99 you can expect an possible compound annual return of 25.41%
- purchase at R46.70 you can expect an possible compound annual return of 23.78%
- purchase at R64.87 you can expect an possible compound annual return of 20.00%
Always look at this and keep in mind that Buffett managed to secure 20%-plus compounded annual returns over more than 40 years by buying at the right price and sticking to his strategy. My recommendation therefore is not to buy at the current priceMy thinking about this conclusion is as follows. Truworths is a great company with solid stability, solid growth, great sustainability, and great economics, but at R83.00 per share: - there is no margin of safety in your purchase - something that should worry you!
- you are buying a great company at a premium (nothing wrong with this except if you have better investment possibilities)
I would therefore invest in Truworths only if: - I don't have alternative options or,
- I could buy it at a price closer to R65.00 per share giving me the margin of safety (on the DCF valuation) I would expect as well as a great expected return of 20% compounded per annum
I hope you have enjoyed this valuation exercise. I hope this posts helped you to gain an understanding of my security valuation thinking process. Please feel free to contact me in case you have any additional questions or suggestions regarding this, or any other, valuation. Be extraordinary!
Myles Rennie
P.S. The above analysis should not be considered investment advice. I will not be held liable for any investment decisions, or investments, made based on my analysis.
 Knowing what a business, an asset, is worth and what determines that value is a prerequisite for intelligent investment - in choosing investments for a portfolio, on deciding the appropriate price to pay for a share of a publicly traded company, and in making choices when running a business. Value investors believe they can make reasonable estimates of value for most businesses. You could ask the question, if you are buying shares why worry so much about the value of the businesses? The answer lies in what Benjamin Graham said: that every corporate security may best be viewed, in the first instance, as an ownership interest in, or claim against, a specific business enterprise. Understanding valuation will further allow the intelligent investor to identify and understand value creation - a necessity for choosing investments that have a greater chance of yielding better that average returns over the long term (i.e. identifying businesses with growth potential - with a sustainable competitive advantage).
It is true that some assets are easier to value than others, and although uncertainty with value estimates is different for different assets, the core principles remain the same.
Happy Investing and Be Extraordinary!
Myles
 Benjamin Graham is commonly credited as establishing the discipline of security analysis and being the father of Value Investing. He promoted investment as a rational activity, an approach which requires the investor to return to the financial statements in order to avoid huge mistakes and misjudgments. In his seminal book Security Analysis, published in 1935, Benjamin Graham started sharing his approach and ideas with both professionals and casual investors. He drew a line in the sand between investment and speculation. He defined an investment operation as one which, upon thorough analysis, promises safety of principal and a satisfactory return. Any operations not meeting these requirements are speculative. With the publication of Security Analysis the concept of the Value Investor was born, i.e. someone who seeks to purchase a stock at a bargain price – buying a RAND for fifty cents or put differently buy cheap (or rather good value) and sell dear. One can infer from this that there are times during the market cycle when value investors will have fewer opportunities and times when they will have more opportunities in the market. In short, value investors have more buying opportunities in bear markets than bull markets.
Toward the latter stages of bull markets value investors find it very hard to find cheap stocks, whereas there are many businesses falling into this classification toward the end of a bear market. Another interesting phenomenon is that it is almost always toward the end of bull markets that investors (or the markets in general) stop paying attention to fundamentals like book value, cash flow, interest, and various other fundamental ratios to value common stock. These are the greedy times as Buffett calls them (and when he is fearful of the markets). Two examples in recent memory springs to mind: the Dot-Com bubble of 2000 and the American Sub-Prime Housing bubble of 2007. In both cases greed and herding resulted in fundamentals being discarded for the more attractive, and at the time more lucrative, new economy thinking. During both these periods it looked as if value investors were an endangered species. This is because proponents of the New Economy hypothesis always argue that some of the fundamental truths of economic reality had been repealed and that value investors’ days are numbered and are being left behind. Value investors’ opinion will be that the market levels are in the tulip mania (see post below) territory, whereas new economy proponents will argue that the good times are here to stay and that markets will keep on rising. Value investors are very patient and therefore not deterred from their approach. They know that the most important thing when employing a decipline is consistent implementation. Therefore, they quietly await the ever looming bear market that will present the perfect time for them to find great buys (i.e. good valuations) at low prices.
Graham’s original ideas still remain relevant today. Graham’s best known student, or disciple as he likes to refer to himself, is value investor Warren Buffett, whose track record and global fame speaks for itself. Buffett, who had studied different investment theories since the age of 11, says he was struck by the compelling logic of Graham’s approach when he first encountered it. Buffett is by no means the only Graham success story in the world, many other have equally impressive track records, e.g. all the super investors from Graham and Doddsville. Some people refer to Buffett’s approach to value investing as growth-at-a-reasonable-price investing, rather than pure value investing. Buffett's approach is value investing but combined with elements of growth investing, even though Benjamin Graham himself was not a great supporter of valuing and considering potential business growth. In short a growth-at-a-reasonable-price investor buys high quality growth companies when they are experiencing temporary difficulties and have therefore lost favour in the market and thus have an artificially suppressed market price (i.e. buy a RAND for 50 cents).
Since Security Analysis, and later the Intelligent Investor, many other investment approaches have emerged. During the 1950 and 1960 the very popular modern investment theory, based on rigorous mathematical and statistical analysis and on what’s know as the efficient market hypothesis, emerged. Other investment approaches that emerged include growth investment, momentum investment, technical investment, to name but a few main ones. In the last decade or two behavioural finance emerged. Its been built on psychological research that advocates the idea that investors act based on emotions and other factors, e.g. herding behaviour, the tendency or biases to give more significance to the most recent news, good or bad, etc. Behavioural finance challenges the fact that people are unemotional and always act 100% rational, a premise of the efficient market hypothesis. This finding about excessive reaction confirms a long held Value Investing belief that over the long run, the performance of both businesses and their share prices will revert to the mean. At the core of most investment approaches lies the skill, or art, of business valuation, i.e. the technique by which the real or intrinsic value of a business is estimated. Value Investors want to buy stocks whose true value (per share) is much more that the market price (per share) of the stock, because Value Investors believe that over time the market price will reflect the intrinsic value of the business, i.e. it will revert to the mean as mention above.
There are many approaches to valuing businesses. There is general agreement that John Burr Williams’ approach, published as The Theory of Investment Value in 1938, of summing the estimated cash flows a business will produce over its life, and discounting it back to its present value, will yield the value of the business. This is called the discounted cash flow (DCF) approach, present value (PV) approach, or a newer approach called adjusted present value (APV). Then there is the route of multiples, i.e. …. Newer theories, based on option pricing theory, called Real Option Pricing (or Real Options), value businesses like quants value options (for more on Black-Scholes pricing models see Fischer Black and Myron Scholes' 1973 paper The Pricing of Options and Corporate Liabilities). Graham’s approach started with what the business is worth today, rather than to rely only on assumptions about events and conditions far into the future. Therefore, value investors prefer to value a business first by examining the assets of the business, then to look at the earnings power of the business, and if the business shows signs of competitive advantage they value the growth potential of the business via cash flow forecast and DCF analysis.
Graham’s skepticism of cash flow forecast and valuing growth potential is simply because he believed that in most cases the growth is not worth much. In most competitive environments all the value of the growth will be used to buy additional capital required to enable the growth. Therefore, Graham’s approach only values growth that produces returns in excess of the cost of the additional capital, i.e. a type of economic growth which generally only businesses generating excessive profits achieve. One of Warren Buffett’s well publicized criteria to picking winning investments is that the business, underlying the investment, should have a sustainable competitive advantage, this is because he is looking for the growth stocks at value prices. Businesses with a sustainable competitive advantage are in some way protected, by various forms of barriers to entry (or what Buffett calls a business moat), from competitors entering their market and driving down their excess profits. Therefore, value investors interested in the growth value of a business will pay careful attention to the strategic positioning of the business. Again ahead of its time was that this assessment of the strategic position of a business, now commonplace among the most sophisticated investors, was inherent from the start in Graham’s approach. Next we consider the basic tenets of value investing as well as valuation in a little more detail.
Be Extraordinary!
Myles
 What are some great sources of investment opportunity? Source include stock market correction or panic like a bull-to-bear market switch, industry recession, business calamity, war, or structural changes? The perfect buying situation is when a stock market correction or panic is coupled with an industry recession or an individual business calamity or structural changes or war.
Recessions signal the start of great buying opportunities, for the value investor with spare cash available. Recovery time from a recession is generally anything between one to four years and during this time there are excellent buying opportunities. During recessions the manic-depressive Mr. Market goes into panic mode and out of fear offers to sell great companies often at single digit PEs. The true value investor understands that during a recession period everyone gets hurt, but the strong survive while the weak are removed from the economic landscape. Sticking to intrinsic value calculations and focusing on business fundamentals, while ignoring manic price fluctuations, allows the value investor to pick up fantastic businesses at bargain sale prices.
Recessions are so important to the value investor we will discuss it further. George Soros, the famous macro investor, observed business boom-bust cycle markets so often during his career he formulated a graphical model of it and constructed his own market theory he called reflexivity. In his market theory he does not specify the cause of such boom-bust cycles, but he speculates that they always have a political element. Government economic intervention as the cause of business cycles has been extensively written about by various authors, including those from the Austrian School of economics. They write that an extra market force (in the case the central bank of a country) can initiate an artificial, or unsustainable, economic boom. They further write that a money-induced boom contains the seeds of its own destruction, i.e. the market upturn, must by the logic of market forces set in motion, be followed by a downturn.
When markets, or the economy as a whole, are not performing optimally politicians can interpret this situation as a threat to their elected positions. If they do, they will often take corrective action to rectify the situation before it becomes a political issue during election time. One of the popular methods of stimulating economic activity is to increase the money supply. This expansion of the money supply leads to lower interest rates. In turn lower interest rates generally lead to an overconsumption in the market as well as lower discount rates (i.e. lower cost of debt thus lower weighted cost of capital). These lower discount rates in turn lead to increased business valuation calculations, or valuation inflation, and increased malinvestment to the valuation inflation.
Over-consumption and lower cost of debt leads to increased revenues, allows businesses to expand, and leads to greater profits. This process can very easily lead to a speculative bubble, i.e. from price increases due to valuation increases, to increased investor enthusiasm, to increased demand, and hence further price increases. When a bubble starts forming, substitutes for business fundamentals start to justify the politically motivated economic boom. Therefore, as fundamental data no longer justifies the boom, market participants replace fundamental analysis with fundamental substitute analysis that will support the boom. These substitutes are always consistent with the perceived new economic conditions driving the boom (e.g. stocks are values at multiples of revenue, not earnings, and growth is funded by selling stock, not executing sound business plans). This leads to a situation where a substantial gap between market behaviour, or speculation, and fundamentals forms and widens.
This ever widening gap however cannot continue indefinite and at some point the market has to correct, it has to abandon the substitutes and re-establish fundamentals. This does not happen however before the last marginal investors in the market buy in. As the old saying goes: what the wise man does in the beginning, the fool does in the end. This final marginal buying further fuels the gap and is the boom’s final push. At this point the politicians have to cool down the market bubble in order to avoid a market crash. Interest rates are raised to reduce consumption and increase discount rates, which causes valuations to decline and malinvestment to halt.
Now the actual fundamentals start to decline as a result of lack of buying and together with rising interest rates the fundamental substitute’s starts to deteriorate. This deterioration starts the investment liquidation cycle and marginal short selling. This market behaviour feeds off itself resulting in mass selling. This triggers investors to take a so called flight to quality that involves liquidating perceived risky investments in favour of government securities or precious metals to preserve the balance of their portfolios. This process typically continues until the true fundamentals decline below pre-bubble levels. As Warren Buffett says: a pin lies and wait for every bubble, and when the two eventually meet, a new wave of investors learn some very old lessons.
At this point malinvestments are liquidated and recovery of the market can begin. Fundamentals and market conditions reconcile again and economic growth can again begin. There is however the chance of recession or depression, based on the severity of the crash. Therefore, often this phase is met with a new wave of government intervention in order to shorten the duration of the correction cycle and fuel economic growth.
The second of our ideal buying opportunities is linked to business calamity. Sometimes great companies make mistakes which cause them to lose money. This creates concern in the market and their share price reflects this by declining sharply. This in turn represents a great contrarian buying opportunity. The value investor has to determine whether this is a passing calamity or irreversible damage. A company with an identifiable competitive advantage almost always has the financial durability to survive calamity. Deciding whether the calamity is correctable is important. Even more important is whether the calamity affect’s the competitive advantage of the company, in which case the investor should not consider investing. Often just one division of a company suffers a calamity, but affects the entire company. If the investor believes that management can fix the calamity or that the other divisions, with the competitive advantage, can save the company then the investor should consider investing if the price is right.
The final opportunities arise with structural changes and world events like war. Structural changes in a company, like mergers, restructuring, and reorganizations, can often affect earnings negatively and thus negatively affect the share price thereby creating buying opportunities. War, or the threat thereof, will send stock prices tumbling. The uncertainty and great potential for disaster will send fear through the entire market triggering a mass sell-off and a hoarding of cash and safe commodities like gold. This in turn disrupts the entire economy and creates great buying opportunities for the value investor who can determine which companies will recover from the ones that won’t.
Be extraordinary!
Myles Rennie
 Benjamin Graham's favorite allegory was that of Mr. Market. He said that Mr. Market turns up every day at our door offering to buy or sell his shares at a different price. Often, the price quoted by Mr. Market seems plausible, but often it is ridiculous. We are free to either agree with his quoted price and trade with him, or to ignore him completely. Mr. Market doesn't mind this, and will be back tomorrow to quote another price. The point is that we are better off not being concerned with Mr. Market’s often irrational behavior except when we can benefit from it.
If Benjamin Graham is right, if market prices are frequently nonsensical, then we would be foolish to use price as a sole indicator of performance. Although this is true, the majority of the investment industry is focused only on price. If prices go up, most investors assume something good is happening, and if prices go down they assume something bad is happening. I prefer not to base my actions on the ups and downs of market prices.
This problem is compounded by the foolish habit of evaluating price performance over very short time periods. Not only do most investors depend on the wrong thing, i.e. price, they also look at it too often. I believe this price based, short term mentality is a flawed way of thinking. I don’t check stock quotes every day and I don’t buy and sell at the snap of a finger.
I do not want to participate in the senseless short term game of chasing performance, measured totally by price. There is considerable pressure on portfolio managers to generate short term performance numbers. These numbers attract a lot of attention and are praised by financial reporters. This fixation on short term price performance attracts a lot of new deposits into the top performing funds. I do not believe that focusing on short term performance is sustainable. Shareholder wealth in businesses is created over time and therefore I expect my investments in great businesses to follow this trend. I believe that any other approach all but guarantees underperformance. Warren Buffett states that we have to drop our insistence on price as the only measuring stick, and we have to break ourselves of the counterproductive habit of making short term judgements.
My approach opens itself up to short term underperformance. Shahan showed that investors focusing on short term performance will inevitably achieve it, but at the expense of long term results. I accept that in order to achieve long term results I have to be indifferent to short term performance. Examining portfolios managed by Buffett, Munger, Ruane, Simpson and Keynes shows that on average their portfolios underperformed the S&P500 26% of the time during the lifetime of the fund. Munger and Ruane’s portfolios respectively underperformed the market 36% and 37% of the time, with Carlie Munger trailing the market by 37 percentage points at one time. These superinvestors all experienced trailing performance at one time or another, some having to endure years of trailing the market.
I therefore know I could be trailing the market for some periods of time. If I know that price is not a good measure of performance I have to define an alternative. Here I follow Warren Buffett’s lead. Just like Buffett I believe that my economic fate will be determined by the economic fate of the businesses I own. I believe that shareholder value and operating results are the correct measures of performance. I let the economics of the business dictate whether I am increasing or decreasing the value of my holdings. I believe, like Buffett, that the market will at times ignore business success, but eventually confirm it.
In conclusion, I believe there is a strong correlation between the operating earnings of a company and its future share price, given the appropriate time horizon. In other words, the longer the time period, the stronger the correlation. Warren Buffett says that a strong business will eventually command a strong price. He does caution that the translation of earnings into share price is both uneven and unpredictable. Benjamin Graham gave the same advice saying that in the short run the market is a voting machine but in the long run it is a weighing machine.
My investment horizon is measured in years and I am in no hurry to affirm what I already know is true. What is important to me is that the intrinsic value of my investments is increasing at a satisfactory rate.
Be extraordinary!
Myles Rennie
 Both value investing and focus investing aim to keep portfolio turnover very low. The turnover ratio describes the amount of activity in a portfolio. For example, if a portfolio manager sells and re-buys all the stocks in the portfolio once a year, or half the portfolio twice, the turnover ratio is 100 percent. Sell and re-buy everything twice a year, and you have 200 percent turnover.
My investment philosophy includes a simple principle: once a stock has been properly selected and has proven itself, it is only occasionally that there is any reason for selling it at all. Therefore, I prefer a low turnover approach to investing. This approach has two additional benefits:
1. It works to reduce transaction costs
2. It increases after-tax returns
On the average mutual funds generate between 100 percent and 200 percent turnover ratios per year. Studies have shown that funds with low turnover ratios outperform funds with high turnover ratios by as much as 14 percent over a 10 year period. The bottom line is every time you trade it costs money, i.e. add brokerage costs, which works to lower your net returns.
Another important economic advantage of low turnover funds is the postponing of capital gains tax. The more you turn the more you increase your tax liability. Every time a stock is sold, and a capital gain is realized, the capital gains tax is incurred. Therefore, not only does any new stock purchased have to outperform the stock it replaced, it has the anchor of outperforming the capital gains tax associated with the stock it replaced as well. Few investors realize this, but taxes are often the biggest expense that they face.
When a stock appreciates in price and is not sold the increase in value is unrealized gain. No capital gains tax is owed until the stock is sold. I prefer to leave the gain in place, allowing my investments to compound more forcefully. Warren Buffett calls this “an interest-free loan from the Treasury.” Interestingly, but counter intuitive, is that the greatest tax damage to a portfolio occurs at the outset of turnover and then diminishes as turnover increases. A study by Jeffrey-Arnott showed that, at a 25 percent turnover ratio, the portfolio incurs 80 percent of the taxes that would be generated by a portfolio turnover ratio of 100 percent. Therefore, I am mindful of my turnover ratio even though it’s in the low range. My target turnover ratio is somewhere between zero and 20 percent.
Be extraordinary!
Myles Rennie
 There are good reasons to exit an investment position. The best reason to liquidate a position is when someone wants to buy a home, pay school fees, etc. These personal reasons to sell stocks are all reasonable and not considered here. Liquidation of an investment position, as far as I am concerned, is only motivated by a single objective – to obtain the greatest total RAND benefit from the investment capital available.
I believe there are three reasons for the sale of a common stock. These reasons are purely financial and never personal. The first reason is obvious. This is when a mistake has been made in the original investment and it becomes increasingly clear that the factual information, i.e. simplicity of the business, durability of competitive advantage, quality of management, and good economic position, of the investment is, by a significant margin, less favorable than originally believed. Managing these situations requires self-control and the acknowledgement of your mistake.
The second reason to sell a stock is when, over time, the underlying company changes and no longer qualifies in regards to my investment criteria set out in valuation of a common stock to about the same degree it qualified at the time of purchase. For this reason it is important for me to keep close contact, and up to date, on all the activities of all my investments all the time.
The final reason to sell a stock seldom arises and will be acted upon only when I am very sure of my facts. I don’t time the market, I price the market. Therefore, in order to exchange one position for another the new position should present similar or better business simplicity characteristics, an equal durable competitive advantage, and similar quality of management as the existing investment. It further has to present better price to intrinsic value economics, as well as better growth prospects, than the current investment. Only if these factors are all applicable and in favour of the new investment, including the effect of capital gains tax on the investment returns, will one position be sold to enter a new position.
Good investment opportunities are rare and there is always the risk that the new opportunity has been misjudged. Therefore, before selling a good holding in order to get a still better one, the greatest care will be taken in trying to evaluate all elements of the situation. In closing, my investment philosophy includes a simple principle. This is that once a stock has been properly selected and has proven itself, it is only occasionally that there is any reason for selling it at all.
Be extraordinary!
Myles Rennie
 My investment philosophy starts with a very simple statement “I invest, I don’t speculate”. The difference can be considered subjective, but I see a clear distinction between investment and speculation. Firstly, an investment approach relies on a well understood, analytic philosophy designed to deliver superior investment returns over time. Speculation on the other hand relies on spotting trends, taking chances, and does not consider capital protection. My investment approach looks to find businesses that are easy to understand, have a durable competitive advantage, have high quality management with a lot of integrity and energy, and finally sells at a price that is below its intrinsic value. From this it is clear that my investments returns are not based on chance, it is based on a fundamental analysis of both the balance sheet and the earnings power of the underlying asset. I look toward these valuations to justify the price I pay for owning a share of the asset.
I do not look at share prices every day or every week. I invest based on business fundamentals. The business fundamentals of a solid business do not change on a daily or weekly basis. Therefore, if I considered a company good enough to invest in yesterday, I am pretty confident that company will still be good enough today and tomorrow. Most people however look to the market to guide them when making investment decisions. When I, on the other hand, consider investments I ignore the market completely because I believe the market to be manic depressive, behave irrationally, and be driven by the human emotions of fear and greed. Therefore, I choose not to use the market to instruct or guide me, I choose to use the market to serve me. I prefer to take advantage of the ups and downs of the market, to my advantage, rather than the market taking advantage of me.
My investment approach is a combination of value investing and focus investing.
Be extraordinary!
Myles Rennie
|
 RSS Feed